04/02/23
Digital Pathology 2.0
volume rendering of Whole Slide Images is spatial pathology
Low-hanging fruit
For the past 30 years, digital pathology has promised to change pathologists’ workflow. The major enablers of digital pathology are Whole Slide Image (WSI) technologies that address many issues we take for granted via features like annotating images with text descriptions or sending slides (WSIs) to remote specialists for second opinions. Image acquisition scanners, display and administration software, as well as accompanying communication and storage systems, are all included in today's WSI systems.
The FDA approved the first WSI system produced by Philips for primary diagnosis in 2017, with a second approval for Leica in 2019.
The world of digital pathology is still stuck in 2D as WSI systems are still in their infancy. 3D imaging in radiology has been advancing medical fields through techniques like MRI and CT that are routinely used for patient diagnosis and R&D. One of the most important tasks of medical experts using MRI or CT is pathology zone detection and its measurement. In this piece, I will make an argument for 3D imaging in digital pathology via volume rendering of WSIs.
One caveat here is that traditional 3D imaging in radiology allows scientists and clinicians to see inside the human body without making a single incision, whereas that is not the case for pathology. However as digital pathology becomes more widely utilized, it is imperative that we take advantage of WSIs that are already available to us.
I created this 3D histopathology design on Spline for fun, which sparked this piece!
The field of 3D histopathology is relatively new, and the previous work involves datasets that have an appearance and resolution similar to conventional microscopy, which is most relevant for clinical pathologists. However there are other techniques that produce 3D histology data. A pipeline was developed that can generate 3D histology datasets from WSI scans, which includes registration to achieve a coherent volume. Various other efforts have also been made to address the challenges of 3D histology reconstruction, such as multi-modal data and specific applications. Additionally, colour normalization is commonly included in the processing since staining quality often varies between slides.
Although 3D histology data reconstruction at native WSI resolution has been presented previously, the employed visualization systems have been limited to subsampled low-resolution and/or surface-extracted versions, with basic interactions. Furthermore, research on user interaction in histopathology has predominantly focused on WSI, i.e., the 2D case. Studies have explored view navigation logs to reveal patterns and exploratory strategies, and evaluations of different types of input devices have been conducted.
Why
The size of a tumour is a significant factor in predicting survival rates for cancer. Tumour volume is directly proportional to the number of cancer cells and could potentially provide a more precise estimate of size + more accurate predictor of survival.
A 2012 study comparing tumour volume in breast tissue between 2D and 3D measurements demonstrates this perfectly:
Spatial relationships: Volume renderings allowed for spatial relationships between key features to be visualized and observed, like tumour foci and close/involved margins.
Tumour burden: Conventional pathology was shown to have a tendency to underestimate the burden of invasive tumours in comparison to volumetric techniques. For example, an infiltrative pattern may be underestimated by up to 30% (!), while localized massises may be underestimated by 3% for invasive tumours and up to 40% (!) for in situ components.
Tumour volume approximated from 2D measurements was seen to overestimate volume compared to 3D volumetric calculation (by a factor of 7x for the infiltrative pattern and 1.5x for the localized invasive mass)
Volumetric Data
Volumetric data is a type of data that describes a 3D space or volume. Volumetric data visualization involves the creation of graphical representation of data sets that are defined on three-dimensional grids. Volume data sets are characterized by multidimensional arrays of a scalar field. These data are typically defined on lattice structures representing values sampled in 3-D space.
Volumetric data can be thought of as a collection of data points or voxels (volumetric pixels) arranged in a three-dimensional grid. Each voxel contains information about the properties of the material or substance within that part of the volume, such as density, temperature, or chemical composition.
It’s a set S of samples (x, y, z, v), representing the value v of some property of the data, at a 3D location (x, y, z). The value is simply a 0 or a 1, with a value of 0 indicating background and a value of 1 indicating the object, then the data is referred to as binary data. The data can also be multivalued, with the value representing some measurable property of data, like colour, density, heat, or pressure – all likely applicable for pathology. While samples can be taken at random locations in space, the set S is isotropic in most cases, containing samples taken at regularly spaced intervals along three orthogonal axes (x, y, z).
Spatial pathology
Spatial biology has emerged as a prominent field of study and application, especially as it relates to pathology. Spatial biology examines the types of cells that are present, their distribution throughout the tissue, the patterns of biomarker co-expression, and the organization and interactions they partake in to shape the tissue microenvironment (TME).
Ultimately, you learn new biological insights by analyzing cells in their environment spatially. Traditional histology & tissue imaging have always allowed for this spatial information, but lack molecular information. Molecular tools are "tissue destructive" and lose spatial information. New technologies allow us to get molecular data AND preserve spatial data.
Spatial Bio has the capability to enhance the depth of our understanding of disease mechanisms and interpreting what cellular changes are clinically meaningful. There are applications across metabolomics, transcriptomics, proteomics, and more.
Why doesn’t spatial bio as it relates to pathology include studying tumours volumetrically?
A business case
3D medical imaging has revolutionized both radiological diagnosis and surgical planning. Adding 3D histopathology to the mix can be game-changing. Benefits could include
Decreased exploratory time in the OR
Less damage to healthy tissues
Lower risk of complications for the patient
Reduction in costs via
Increased diagnostic sensitivity across all specialties
Likelihood of shorter OR time per procedure
Enhanced quality of care
While I have not gone in depth with a cost-benefit analysis or implementation models, there definitely is a business case here that I hope to explore in the future.
A non-exhaustive list of published volumetric methods and/or platform designs
VALIS: Virtual Alignment of pathoLogy Image Series (VALIS), a fully automated pipeline that opens, registers (rigid and/or non-rigid), and saves aligned slides in the ome.tiff format. VALIS provides a free, opensource, flexible, and simple pipeline for rigid and non-rigid registration of IF and/or IHC that can facilitate spatial analyses of WSI from novel and existing datasets.
The VALIS alignment pipeline
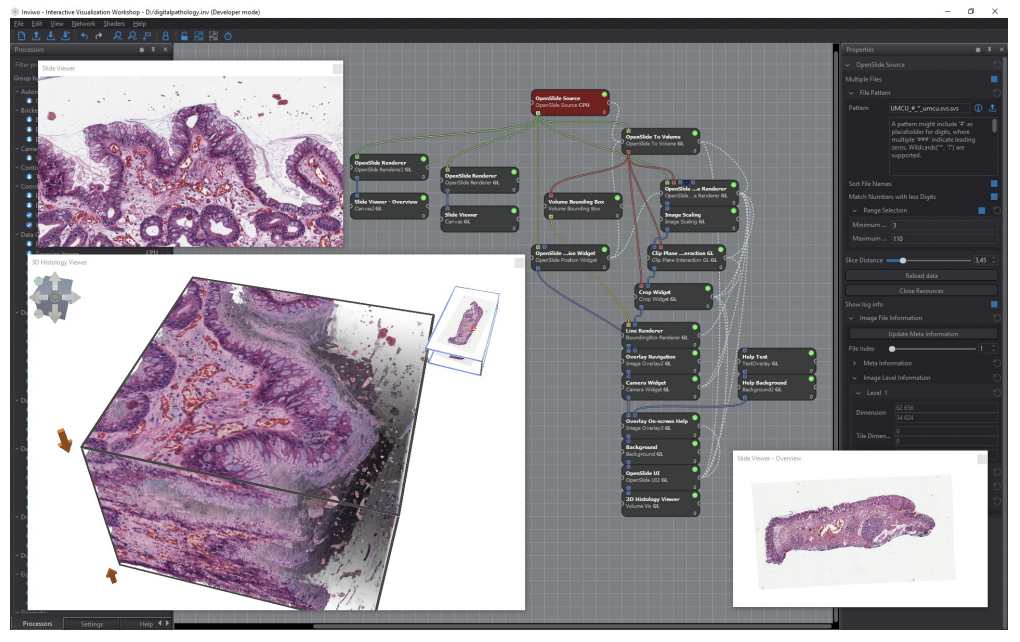
Inviwo: Inviwo is essentially a computing platform interoperable visualization system with usage abstraction levels through a layered architecture. The proposed platform allows algorithms developed for different computing platforms to be used together while still allowing developers to access the underlying computing platforms. The below figure shows an interactive rendering of 100 slide images as well as domain specific navigation. It features details like individual nuclei (spatial pathology?). The visualization of the image stack is based on brick-based volume raycasting, thus enabling large scale data handling of volumetric data within Inviwo.
Visualizing a stack of 100 coloured microscopic slides, each with a resolution of 63,000x35,000 pixels and totaling in 110 GiB of compressed TIFF image data
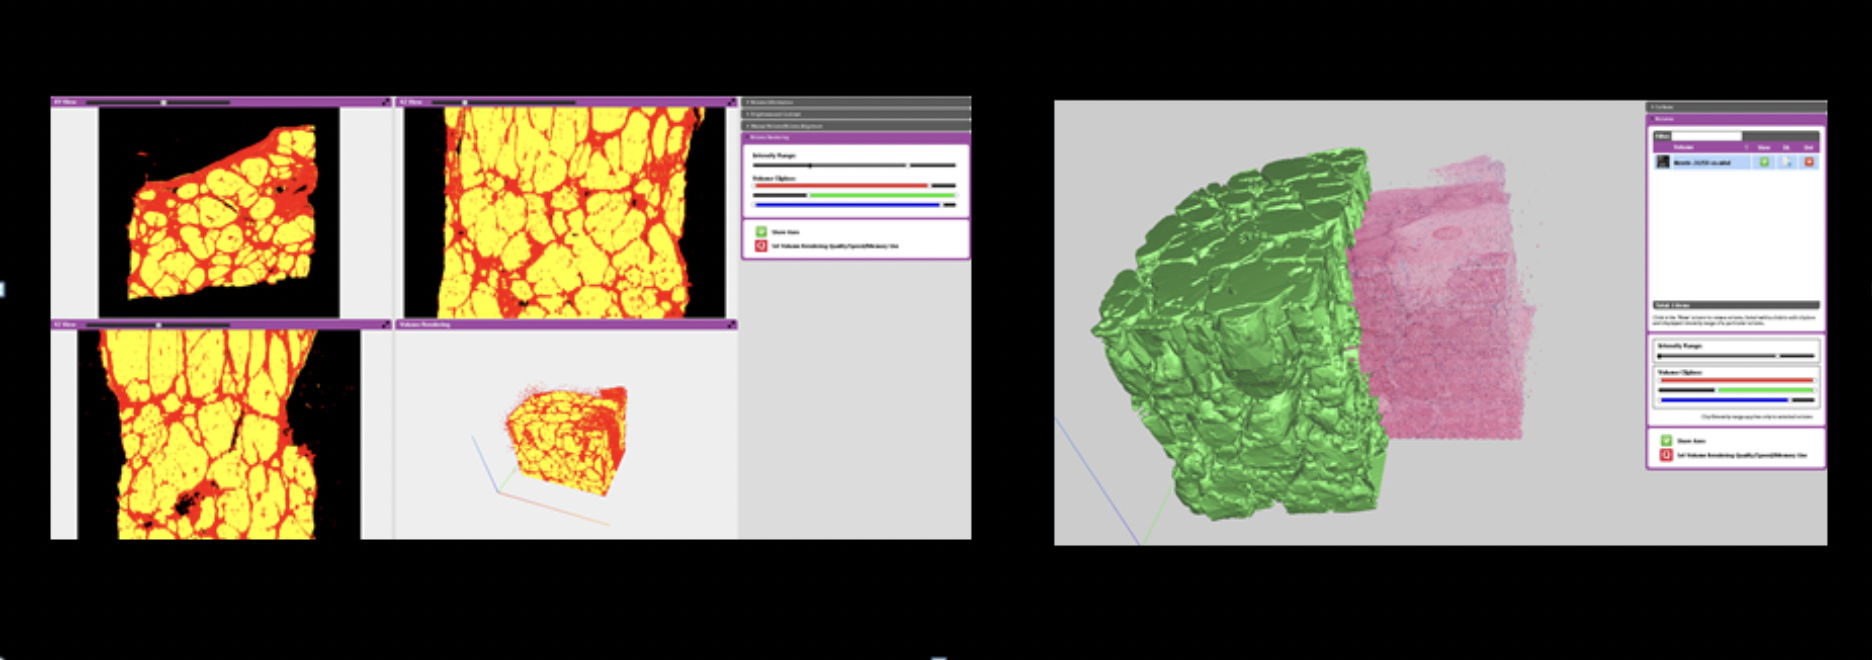
The HeteroGenius Medical Image Manager (HGMIM) is an IMS for both pathology and radiology images. They have a 3D Pathology add-on module that enables the stacking up of hundreds of serial section images to form a volumetric dataset. Despite a simplistic UI, it does seem to be one of the only 3D pathology services available on the market, and probably one of the only also managing alignment of both pathology and radiology images
Integration with HG-MIM Deep Learning add-on allowing classified volumetric data sets and surfaces to be generated
Their pathology : radiology correlation add-on module allows for manual and automatic alignment of WSIs with volumetric data (e.g. radiology of blockface images).
Alignment (inplane rotation/translation, 3D positioning) of Virtual sides within 3D volumetric data via the pathology : radiology add-on
A 2002 project focusing on direct volume rendering techniques to build a large scale 3D database of pathological cases intended as an interactive learning tool for medical students.
A 2018 paper presenting a visualization application that enables effective interactive visual analysis of large-scale 3D histopathology, that is, high-resolution 3D microscopy data of human tissue.
Datasets available for inspection in the open-ended exploration task of the expert evaluation.
(a) Barrett’s esophagus, H&E stain. (b) healthy liver, H&E stain. (c) liver cirrhosis, Sirius red stain. (d) colorectal adenocarcinoma, immunostaining. (e) mouse embryo, H&E stain
This 2018 paper is probably the most comprehensive 3D visualization system with a thoroughly developed rendering pipeline (see below).
Rendering pipeline for the interactive visualization of 3D histopathology data at native resolution
Final thoughts
Until now, clinical workflows and research in pathology have mainly relied on 2D imaging. However, the exploration of volumetric histology data presents novel and useful opportunities for both research and clinical practice. Unfortunately, the current lack of appropriate visualization tools in histopathology has been a hindrance to the adoption of digital pathology. Visualization of 3D histology data is challenging due to the dense and large-scale full-colour datasets, which can be as large as 100,000 x 100,000 x 100 voxels. Consequently, this places significant demands on both rendering performance and experience design. With advancements in digital, it’s possible to overcome these challenges.
3D imaging in radiology like CT has capitalized on the stacking of 2D images allowing for a more accurate representation of the 3D nature of the body’s anatomical structures, and has been associated with better performance. Let’s catch digital pathology up and capitalize on the foundation that are WSI systems.
This piece is 2/50 from my 50 days of writing series. Subscribe to hear about new posts.


